How we quadrupled our traffic to 625K monthly page views ⚡ AMP
Discover how we quadrupled our monthly organic traffic to 625K by launching free, browser-only tools—no extra blog posts or ad spend required.
Our organic website traffic skyrocketed, growing 4x to 625,000 monthly page views in less than two months. The best part? This hockey stick growth hasn’t slowed down—it looks like we’ll easily surpass 1 million page views per month by the next quarter. 🚀
In this blog post, I’ll share what we did, why we did it, and a bit of the backstory.
Hint - We didn’t achieve this growth by writing tons of blog posts or spending money on ads.
The Problem: A slowdown in website traffic growth
We noticed a slowdown in website traffic growth and needed a way to fix it quickly. But not just any traffic—we needed a disproportionately high amount of relevant visitors who could turn into potential customers.
Why Not Blog Posts?
We’ve been writing blog posts for a long time, but ranking at the top keeps getting harder. No matter how good our content is, Google’s algorithm changes constantly, and sometimes, a random 4-year-old Reddit post outranks even the best-written articles. So, relying on blog content wasn’t a viable option.
The Strategy: Build free, useful tools
Instead of focusing on content, we decided to build a few free tools that our potential customers could use immediately, with no ads or paywalls.
After analyzing traffic volume and keyword difficulty, we settled on these three tools:
- Online image format converter - Potential traffic: 6.6M globally, 985K in the US.
- Online image compression tools – Potential traffic: 1.6M globally, 44K in the US.
- Free image and video hosting – Potential traffic: 74K globally, 33K in the US.
From here, we executed fast—and the results were game-changing.
Ahrefs screenshots of traffic potential


We prioritized the online format converter and image compression tool first because they were easy to implement. Our goal was to offer these tools for free without increasing our costs. To achieve this, we developed browser-only solutions where all processing happens locally on the user's device. This ensures fast performance while keeping files completely private, as they never leave the user's device.
Shortly after launch, we began ranking in the top 5-6 positions for these keywords. However, despite Ahrefs indicating low keyword difficulty, we struggled to reach the top spots. It took us some time to realize that both tools faced fierce competition, making it harder to secure the top rankings.
So what now?
Realizing the intense competition for the first two tools, we quickly moved to the third one—free image and video hosting.
While its traffic potential was lower, it was highly relevant to our offering. ImageKit provides a full-fledged digital asset management solution, so the idea of giving marketers and designers a lightweight personal media library resonated with us.
We implemented and launched the tool within a week. It was designed to be simple: users can upload an image or video, generate shareable public links, and even get a CDN-powered link—all without needing to create an account. Just open the page, and it works. We also created a short demo video to showcase its functionality.
Within 10 days, we started ranking in the top 3-4 positions for keywords like "image to URL," "video to URL," and "free image hosting."
A few days later, we launched on ProductHunt, where we ranked 5th, and on Peerlist, where we secured 2nd place. While nothing extraordinary came from these launches, we aimed to maximize visibility. Ultimately, Google search drove the most traffic to the tool.
Despite its low traffic potential, the free media hosting tool ended up driving a significant share of clicks because we ranked at the top. It turned out to be the most valuable tool in terms of both traffic generation and attracting our ideal potential customers for our Digital Asset Management (DAM) product.
Good! Let's talk about numbers now
We were getting a lot of page views and wanted to verify if it was worth the effort and if we should continue or not. To make an informed decision, we focused on a few key metrics:
- SERP rankings - Seeing how we rank on Google, for how many keywords, etc.
- Traffic growth – Tracking total page views and unique users to measure overall reach.
- Basic engagement metrics – Looking at engagement time, page views per user, and how long visitors interacted with our site.
- Traffic to high-intent pages – Monitoring visits to our registration and pricing plan pages to see if users were moving toward conversion.
- Brand queries – Checking how often people searched for "ImageKit" on Google, which indicated growing brand awareness.
- Actual signups – The most critical metric is how many users were signing up for our product as a result of this increased traffic.
SERP ranking
We started ranking in the top 3 positions in the US for 173 new keywords within just two months.

We even managed to rank in the top 3 positions for some highly competitive keywords, which was unexpected.


Beyond ranking at the top, we also gained:
- 97 featured snippets
- 65 AI overview mentions
- 1113 people also ask mentions
These placements significantly boosted our visibility and organic reach.
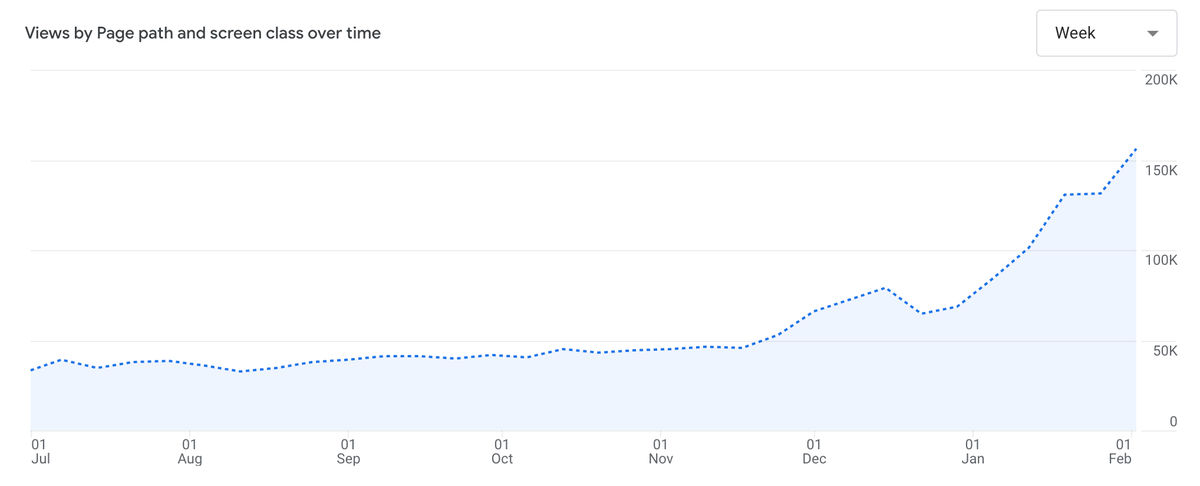
Website traffic
Traffic has increased almost 4x, reaching 156,000 visits per week—and it's still growing.
This excludes traffic from login pages, the dashboard, and our reusable footer iframe. We're only counting direct and organic traffic from Google, Bing, and other search engines.
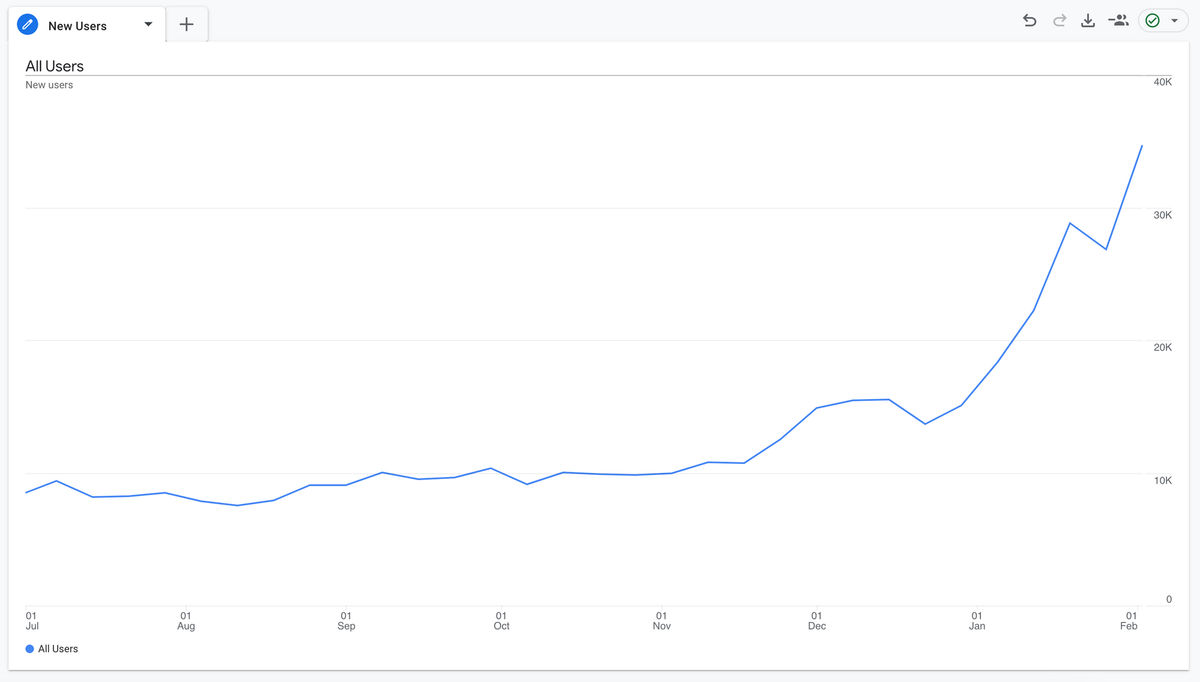
Unique users
Unique visitors have grown 3.5x in the past two months, now reaching nearly 140,000 new users every month—and the numbers keep rising.
If a public link to an asset is shared on Reddit and the post goes viral, our tools capture a share of that traffic.
Page views per user
Page views per user is a strong indicator of how interested someone is in your product—the higher, the better. On our tools pages, engagement was notably high:
- Free image and video hosting tools - 3.95
- Format converter – 5.33 (likely because we have separate pages for different format conversions)
- Blog – 1.25
Overall, these numbers look pretty good.
Engagement metrics
We analyzed Google Analytics' time spent on the page and engagement rate metrics. Unlike page views per user, a higher time spent on the page doesn’t always indicate better engagement. Here’s what we found:
- Format conversion pages – 1 min avg time, 86% engagement
- Image and video hosting – 34 to 1min avg time, 91% engagement
- Blogs – 42 sec avg time, 80% engagement
These numbers make sense. File uploads are quick, and users copy the public URL and leave in under a minute. Format conversion pages take longer, likely because users download files, which explains the higher time spent on the page.
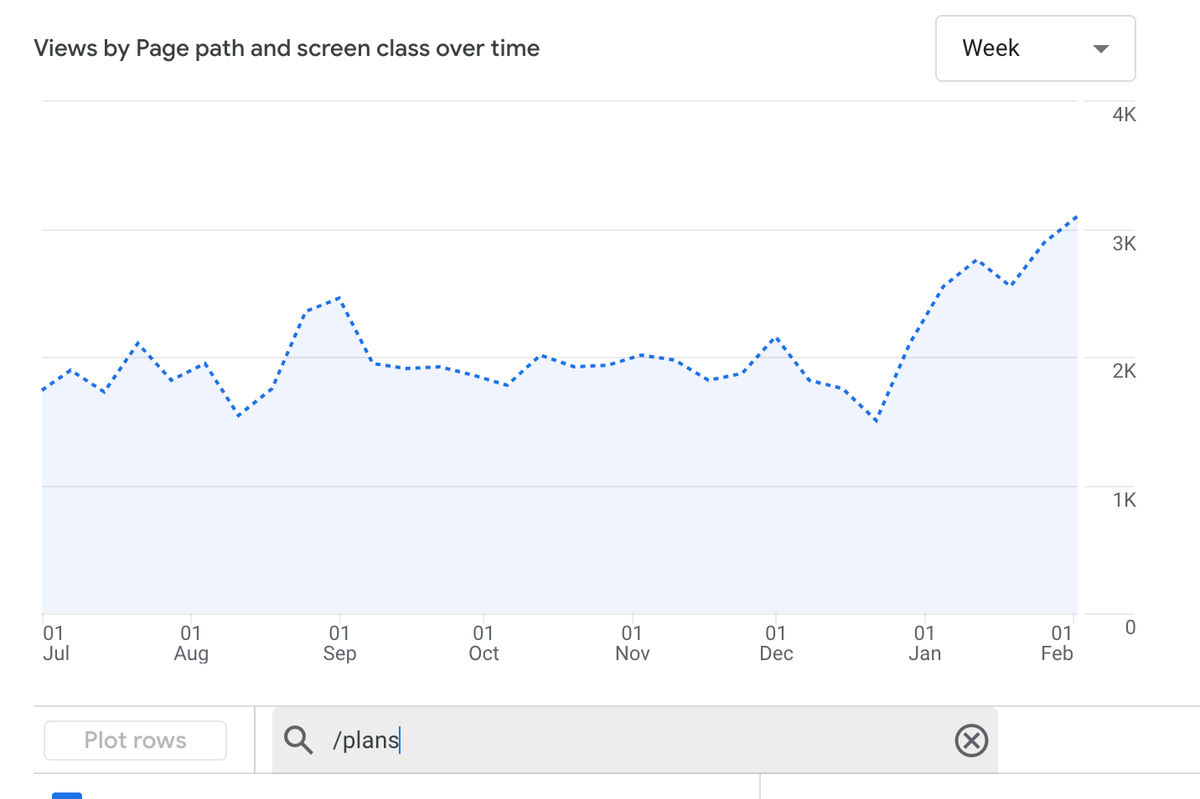
Traffic on the pricing page
If someone visits the pricing page, it’s a strong signal that they’ve learned something about the product. Traffic to the pricing page increased by roughly 33%.
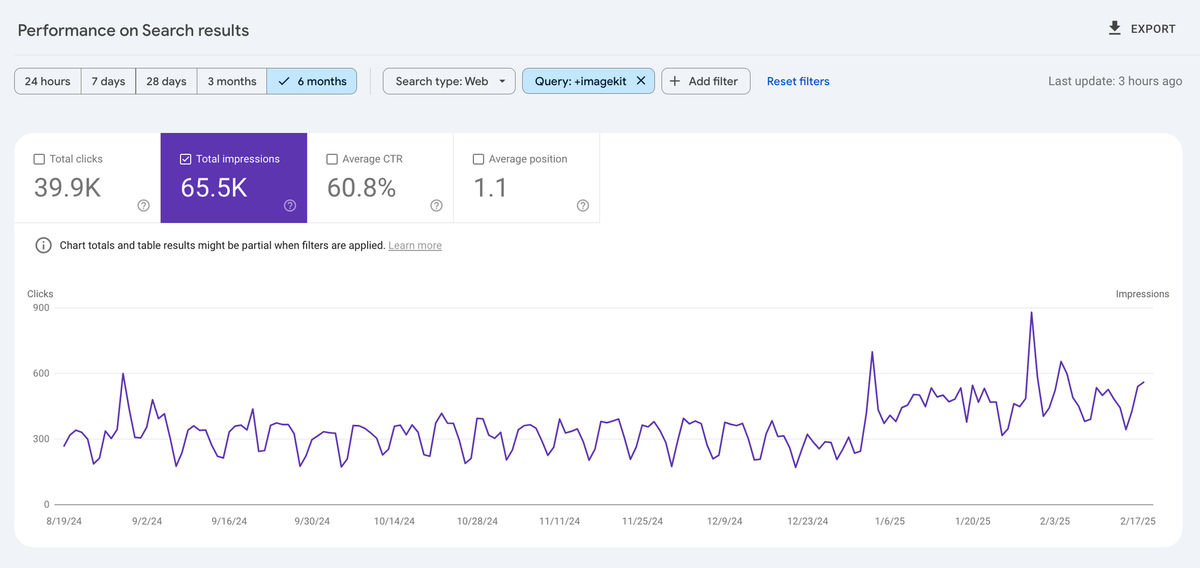
Brand queries
We saw a noticeable uptick in brand searches for ImageKit on Google. However, it's tricky to attribute this entirely to the viral tools, as we also collaborated with a few YouTube influencers around the same time.
To stay on the safe side, we’d attribute this increase more to YouTube, as there's a clear correlation between the video launch dates and the rise in brand queries.
Signup
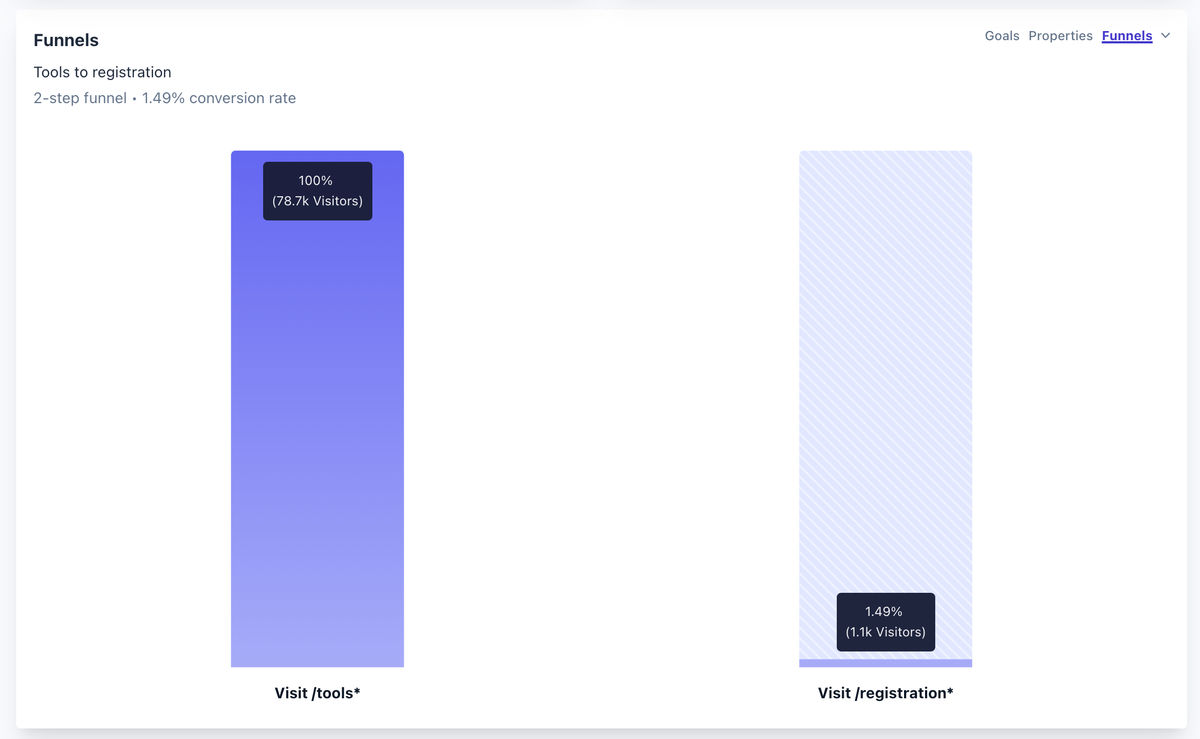
January 2025 saw our highest number of signups so far. We also observed that the tools-to-signup conversion rate was significantly better than the blog-to-signup conversion rate:
- Tools – 1.49%
- Blog – 0.53%
This reinforces the idea that useful tools drive more engaged and conversion-ready users compared to blog content.

The 0.53% blog-to-signup conversion rate is an average across all blog posts, but not every post performs the same. Bottom-of-the-funnel content tends to convert at a higher rate, even if it attracts a smaller audience.
Additionally, it's tricky to fully attribute the overall increase in signups to our tools alone, as this spike coincided with the launch of a few YouTube videos promoting our product.
Way forward
We have more useful tools in mind that marketers, designers, and developers can benefit from. Some ideas we’re exploring:
- Browser-only background removal – While there are existing options, most don’t offer decent output quality. Background removal is a complex problem—high-quality results require downloading large AI models in the browser. We plan to launch this with a trimmed-down version of our AI model (used in our backend) to deliver high-quality background removal without heavy processing.
- Online video compression, resizing, and basic editing tools – Again, browser-only for speed and privacy.
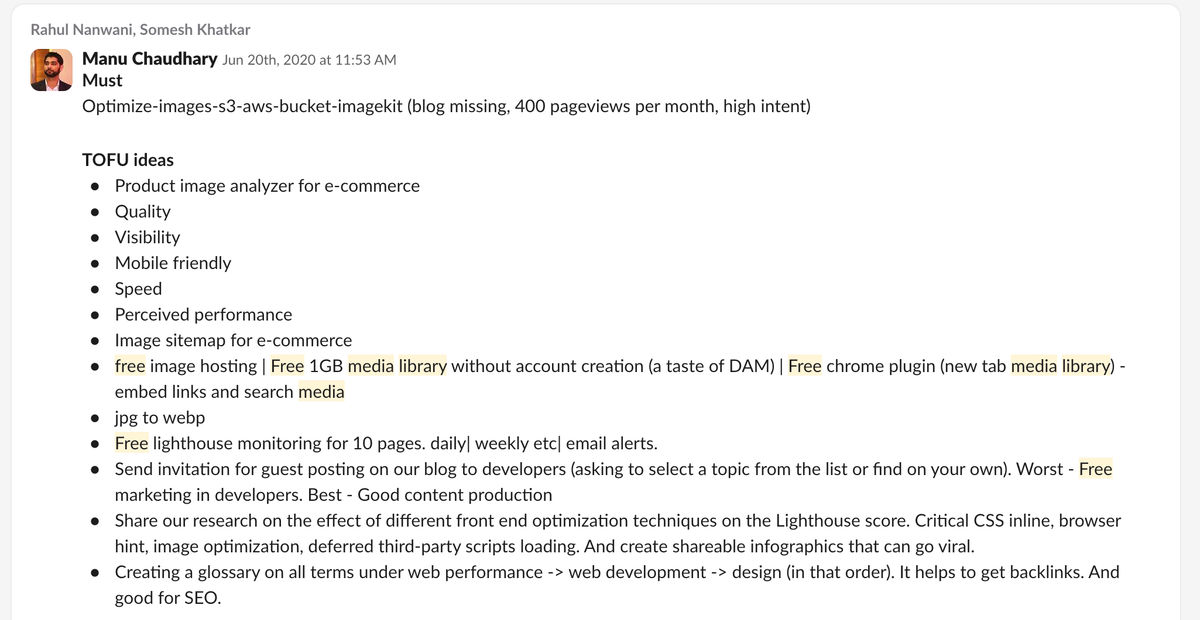
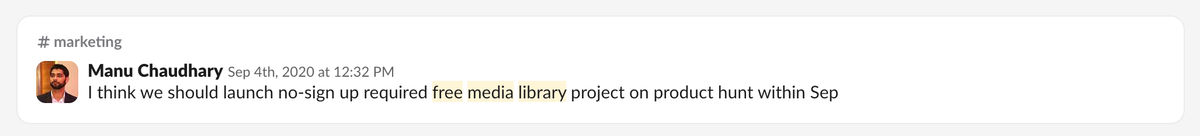
A little backstory
The idea of creating useful, viral tools was first discussed back in June 2020, but for some reason, we never pursued it. Honestly, I don’t even remember why!
Conclusion
- Organic traffic soared 4× in under 2 months, climbing to 625,000 monthly page views and on track to hit 1 million.
- Ranked in the top 3–4 positions for keywords like “image to url” and “video to url” soon after launch.
- Claimed 173 new top-3 rankings in under 2 months, plus 97 featured snippets, 65 AI overview mentions, and 1113 people also ask mentions.
- Unique visitors have grown 3.5× in the past two months, now reaching nearly 140,000 new users per month—and the numbers keep rising.
- Tools to signup conversion is 1.49%, almost triple the 0.53% from blog pages - January 2025 saw the highest signups to date, indicating relevant, high-quality leads.
- Building useful, share-worthy tools drove more effective organic growth than writing additional blog posts.
- If you have noticed, most of our tools do heavy work in the browser. It serves two purposes. First, it doesn't cost us anything in terms of processing on servers. Second, better privacy for users. Their files never leave their computer.