Measure how much bandwidth you saved with ImageKit.io ⚡ AMP
You have been using ImageKit.io for a while now and sometimes get asked: 1. How much bandwidth did we save after using ImageKit.io? 2. Or what would have bee
You have been using ImageKit.io for a while now and sometimes get asked:
- How much bandwidth did we save after using ImageKit.io?
- Or what would have been our daily bandwidth consumption if there was no automatic optimization in the place?
Now you can get answers to these questions from your dashboard analytics.

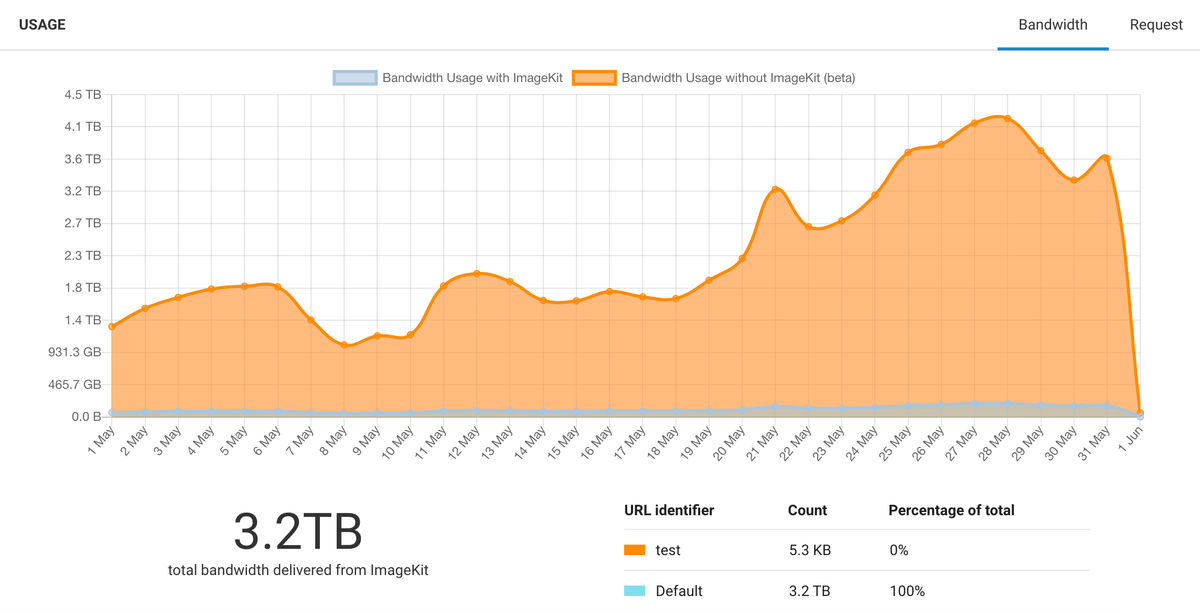
The above image is a screenshot provided by one of our customers. This saving would obviously vary for all of you and also depends on:
- If you are correctly resizing images or not?
- The size of original files – and how unoptimized they were.
But overall, this will provide an exact idea of how much you have saved so far! And if that is not impressive, check out what can be improved using our website analyzer.
Now, combine the savings data with the website analyzer report and create a strategy to optimize images on your website and apps perfectly. Once you are done, start using performance monitoring to get automatic performance alerts (like below) in your inbox for key business pages.

Daily bandwidth savings graph
The usage section now has two graphs:
- Bandwidth usage with ImageKit (your current usage)
- Bandwidth usage without ImageKit.io (current usage + savings)
By clicking on "Bandwidth usage without ImageKit.io" legend, you can plot a daily bandwidth savings graph.
You may notice more savings on a few days compared to others. The reason for the same would be – On a particular day, based on traffic, a specific set of images were requested more than the others. And this could result in not so linear savings graph.
How we calculate these savings?
Every time our core image processing servers optimize or resize an image, we store the corresponding savings number.
Saving = Original file size - file size after resizing & optimization
Now once an image is served, it is cached on the CDN. Our server doesn't get any request for it till the object is evicted from the cache.
So to calculate the cumulative savings on all repeat requests that are served from the CDN, we process CDN logs and combine our savings number for each URL. That means the savings that you see in the analytics are after considering every repeat request.
What else would you like to see?
A lot of customers asked us savings related questions, and we decided to work on it to provide the answers. This feature is in beta, and we would love to hear your feedback.
Let us know what else would you like to see in your analytics.